Top Ten Tips Troubleshooting Tips
for Plant DNA content flow cytometry
Your flow cytometry samples are not working: the CV's are high, the events are low, and there's too much debris. What do you do?
The following are my top 10 things to try.
The first 5 are the most likely to result in significant improvement.
Make sure the flow cytometer is working well and is set up correctly
1
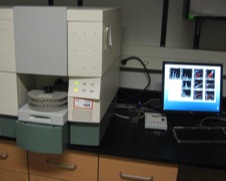
• This may seem obvious, but keep in mind that a machine operator may not be familiar with working with plant tissue, or with your particular application.
• A quality control test should be performed every day to ensure that the machine is performing correctly. Commercial kits are available, but an economical option is to maintain a test species in the lab and to become familiar with the usual quality of a prepared sample. If the machine was tested at the beginning of the day, but quality declines later on, retest it.
• Make sure the parameters have been set by someone who is qualified to do so. For your particular application and machine, should you be using fluorescence intensity (height) or integrated fluorescence (area)? A linear or a log scale? Which parameter is most appropriate for your dye? Will you be using other parameters for gating (post-acquisition), and if so, have these parameters been correctly set as well? Does it matter if compensations have been set (for eg., if you are using two or more colours)?
Use good quality tissue
2
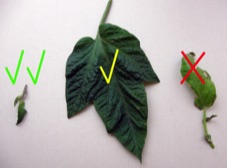
• Most plant work is done with leaves, but this doesn't make every leaf a good choice. Leaves should be healthy, preferably young, and fresh. Leaves that show any sign of senescence should be avoided; leaves collected late in the growing season frequently don't work as well. Avoid letting leaves wilt.
• Depending on the species, fresh leaves will often stay in good condition in a refrigerator for days after collection, if kept in a closed bag with a damp paper towel. Don't let them get too cold (avoid direct contact with ice), or too wet (paper towels should not be “shiny wet”).
• Dried tissue is a possibility, although it doesn't usually work as well as fresh (Suda & Trávníček 2006; 2006b; Suda et al. 2007; Bainard et al. 2011). DO NOT ASSUME THAT DNA CONTENT ESTIMATES FROM DRIED TISSUE WILL BE THE SAME AS THOSE FROM FRESH! In general, the same quality issues apply: if the leaf you collect is not of the highest quality, don't expect it to get better as it dries. On the other hand, good quality tissue, properly dried, may work better than poor quality fresh tissue. The best way to dry tissue is probably using a desiccant, and using enough to dry the tissue rapidly: if it doesn't get brittle overnight, adjust your method.
Use the Right Tissue
3
• Sometimes leaves just don't work. Try buds, roots, flower petals, fruit, or any other healthy tissue. Keep in mind that in species with endopolyploid tissues, the degree of endopolyploidy may vary between tissues (Galbraith et al. 1991); don't overlook 2c peaks that are small relative to other peaks.
• Seeds are a possibility, but keep in mind that endosperm and embryo may differ in ploidy, and that seeds may be hybrids (Sliwinska et al 2005).
Use the right buffer
4
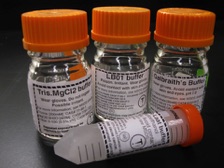
• Buffer choice can have a huge impact on the quality of your data. Just because you get reasonable peaks with the first buffer you try does not mean that another buffer will not improve results. There is some evidence to suggest that buffer choice may influence relative fluorescence as well as peak quality! (Loureiro et al., 2006)
• Some buffers show patterns of geographical preference, and buffers become “traditional” in labs (Loureiro et al., 2007a). The important contribution made by Galbraith in the 1980's in the field of plant flow cytometry has made the Galbraith buffer a common choice (Galbraith 1983). However, there are many other options, and in my experience, others frequently work better.
• My top recommendations are LB01 (Doležel et al., 1989), de Laat's (de Laat and Blaas, 1984, as modified in Kron et al., 2009), and the Otto 2-step method (Otto, 1990). For others worth investigating see Loureiro et al., 2007b, and also see Loureiro et al. (2007a) and Greilhuber et al. (2007) for good general discussions of buffers and a list of commonly used buffers.
• When testing buffers, check for peak quality, but also for consistency of results. It is possible that a buffer may yield very clean samples with low CVs, but highly variable measures of relative fluorescence across replicates (Greilhuber et al. 2007)
• Buffer pH may have a dramatic effect. Buffers should normally be in the pH 7 to 8 range (with special exceptions like Otto's two-step buffer).
Adjust your tissue amount and/or chopping time
5
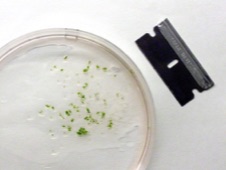
• Over-chopping is a common problem with plants. Chopping too much may overwhelm the buffer, reducing its ability to maintain the pH in the correct range; dark coloration, cloudiness and large amounts of precipitate are usually bad signs. Keeping samples cold during chopping may help (although I generally just keep the buffer on ice). You can often improve sample quality by chopping less, increasing the amount of buffer, or by reducing the amount of tissue in the sample.
• Rule of thumb: Worry about getting good quality (low CV) peaks first, and worry about nuclei number later. Don't destroy the quality of your sample in pursuit of “10,000 nuclei”.
This guideline is frequently misapplied, and actually comes from a guideline of 10,000 cycle events in cell cycle analysis. A 1,300 nuclei/peak guideline is a better one for many applications (Greilhuber et al 2007). Clean samples with 500 events per peak will probably tell you more than 10,000 event peaks with large debris curves and high CVs (See for eg. Suda et al. 2007).
Adjust staining time and conditions
6
• When standard protocols and an appropriate buffer are used, stained nuclei seem to be robust for at least 2 hours in buffer. However, this is not always the case, and nuclei may begin to degrade at some point that is species-specific. A good rule of thumb is 20 minutes to 1 hour between staining and running, with as little as 10 minutes and as much as 2 hours as extreme limits. This is not to say that longer staining times won't work in some cases, but you should not assume this.
• Staining at room temperature (for short periods) usually works, and may be preferable in some cases. However, for longer staining periods, it's probably better to keep samples cool (and dark, to maintain fluorescence). Opinions differ; you may want to experiment with this.
Consider using DAPI
7
• Lower CVs are frequently reported when using DAPI as a stain, rather than propidium iodide (PI) (eg. Doležel & Göhde 1995; Doležel et al. 2007). DAPI is usually not recommended for DNA content measures because it is base-pair specific, so differences between samples may reflect differences in base-pair composition rather than differences in DNA content. However, small differences of this kind may not matter for your particular application.
• DAPI also requires a different excitation wavelength than PI, so check to see if your machine has the correct light source.
Try centrifuging
8
• Probably the most common approach to sample preparation involves chopping tissue in a buffer to which the stain (usually PI) has already been added, filtering, and running the sample. However, an alternative is to chop in a buffer without stain, filter, centrifuge (high speed for 30s or low speed for 5-10 min), remove the supernatant, and resuspend the pellet in about 0.5 ml of buffer with stain (amount may vary depending on your cytometer). This may clean up some samples.
Try a different standard
9
• If problems only occur when you are using a second species as an internal DNA content standard, the standard may be interfering with the quality of your plant's peaks (for example, through the effects of secondary metabolites; see Loureiro et al, 2006 and references therein). Seeds for a variety of DNA content standards are available from J. Doležel (see Doležel et al. 2007).
Gate your samples (carefully)
10
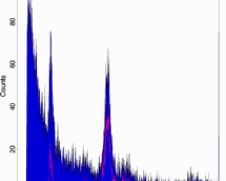
• Even when peaks are small and there is a lot of debris, peaks may be measurable following gating with appropriate software. A helpful way to gate PI-stained samples is with a scatterplot of orange vs red fluorescence, because nuclei fall out on a tight line while certain types of debris “fall off the line"
• Be careful! Removing debris through gating can affect the way curve-fitting software analyzes histograms. Also, tight gating of nuclei clouds on scatter plots generates peak CVs that are somewhat subjective and possibly artificially low.
• Gating methods should be clearly described in any publication!
• Perhaps most importantly, samples with large amounts of debris relative to nuclei should be considered suspect, because the debris may be interfering with staining. Gating such poor quality histograms should only be done when all other options have failed.
A few other things to consider
• A method for filtering samples that is reported to help with recalcitrant tissue is described by Lee & Lin (2005). I have not tested this approach myself.
• Some tissue types may require special approaches. For example, pollen nuclei can be difficult to extract, and methods other than chopping may be required. For reviews, see Suda et al., 2007 and Kron and Husband, 2012. For our “filter bursting” method see Kron and Husband, 2012.
• Not all flow cytometers are created equal. Some may produce better results than others, depending on factors such as nuclei size. If you have the opportunity to try more than one machine, the results may be illuminating.
Good luck!
Paul Kron
Integrative Biology, University of Guelph
pkron@uoguelph.ca
A note about references: I have not tried to include citations for every point here, particularly when the recommendations are related to common practices, but a debt is owed to the entire plant flow cytometry community. Many of these recommendations also appear in Doležel et al., 2007, for example. If you feel that a citation is missing that should be included, please let me know and I will correct the omission.
Literature cited
Bainard, J., Husband, B., Baldwin, S., Fazekas, A., Gregory, T.R., Newmaster, S., and Kron, P. (2011). The effects of rapid desiccation on estimates of plant genome size. Chromosome Res. 19, 825–842.
de Laat AMM, Blaas J. 1984. Flow-cytometric characterization and sorting of plant chromosomes. Theor. Ap. Gen. 67:463-7
Doležel J, Binarová P, Lucretti S. 1989. Analysis of nuclear DNA content in plant cells by flow cytometry. Biologia plantarum (Praha) 31: 113-120
Doležel J, Göhde W. 1995. Sex determination in dioecious plants Melandrium album and M. rubrum using high-resolution flow-cytometry. Cytometry 19:103-6
Doležel J, Greilhuber J, Suda J. 2007. Estimation of DNA content in plants using flow cytometry. Nature Protocols 2233-44
Galbraith DW, Harkins KR, Maddox JM, Ayres NM, Sharma DP, Firoozabady E. 1983. Rapid flow cytometric analysis of the cell cycle in intact plant tissues. Science 220: 1049-51
Galbraith DW, Harkins KR, Knapp S. 1991. Systemic endopolyploidy in Arabidopsis thaliana. Plant Physiol. 96:985–89
Greilhuber J, Temsch EM, Loureiro JCM. 2007. Nuclear DNA content measurement. In Flow Cytometry with Plant Cells: Analysis of Genes, Chromosomes and Genomes, eds. J Dolezel, J Greilhuber, J Suda, 4:67–101. Wiley–VCH Verlag GmbH & Co. KGaA, Weinheim
Kron P, Husband BC. 2009. Hybridization and the reproductive pathways mediating gene flow between native Malus coronaria and domestic apple, M. domestica. Botany 87:864-74
Kron, Paul, and Brian C. Husband. "Using flow cytometry to estimate pollen DNA content: improved methodology and applications." Annals of botany 110.5 (2012): 1067-1078.
Lee HC, Lin TY. 2005. Isolation of plant nuclei suitable for flow cytometry from recalcitrant tissue by use of a filtration column. Plant Mol. Biol. Rep. 23:53–58
Loureiro J, Rodriguez E, Doležel J, Santos C. 2006. Flow cytometric and microscopic analysis of the effect of tannic acid on plant nuclei and estimation of DNA content. Ann. Bot. 98:515–27
Loureiro J, Suda J, Doležel J, Santos C. 2007a. FLOWer: A Plant DNA Flow Cytometry Database. In Flow Cytometry with Plant Cells: Analysis of Genes, Chromosomes and Genomes, eds. J Dolezel, J Greilhuber, J Suda, 18:423–438. Wiley–VCH Verlag GmbH & Co. KGaA, Weinheim
Loureiro J, Rodriguez E, Doležel J, Santos C. 2007b. Two new nuclear isolation buffers for plant DNA flow cytometry: A test with 37 species. Ann. Bot. 100:875-88
Otto F. 1990. DAPI staining of fixed cells for high-resolution flow cytometry of nuclear DNA. Methods in Cell Biology 33: 105-110
Sliwinska E, Zielinska E, Jedrzejczyk I. 2005. Are seeds suitable for flow cytometric estimation of plant genome size? Cytometry 64A:72–79
Suda J, Trávnicek P. 2006a. Reliable DNA ploidy determination in dehydrated tissues of vascular plants by DAPI flow cytometry: new prospects for plant research. Cytometry 69A:273–80
Suda J, Trávnicek P. 2006b. Estimation of relative nuclear DNA content in dehydrated plant tissues by flow cytometry. In JP Robinson, Z Darzynkiewicz, J Dobrucki,WHyun, J Nolan, et al., eds., Current Protocols in Cytometry, pp. 7.30.1–7.30.14, John Wiley & Sons, New York
Suda J, Kron P, Husband BC, Trávnícek P. 2007. Flow cytometry and ploidy: applications in plant systematics, ecology and evolutionary biology. In Flow Cytometry with Plant Cells: Analysis of Genes, Chromosomes and Genomes, eds. J Dolezel, J Greilhuber, J Suda, 5:103–30. Wiley–VCH Verlag GmbH & Co. KGaA, Weinheim